Ctrl+K

napari-matplotlib

  • User guide
  • Gallery
  • Third-party plugins
  • API reference
  • Changelog
  • GitHub
  • User guide
  • Gallery
  • Third-party plugins
  • API reference
  • Changelog
  • GitHub

Section Navigation

  • Scatter plots
  • 1D slices
  • Histograms
  • Scattering features
  • Hisogram of features
  • Gallery
  • 1D slices

Note

Go to the end to download the full example code.
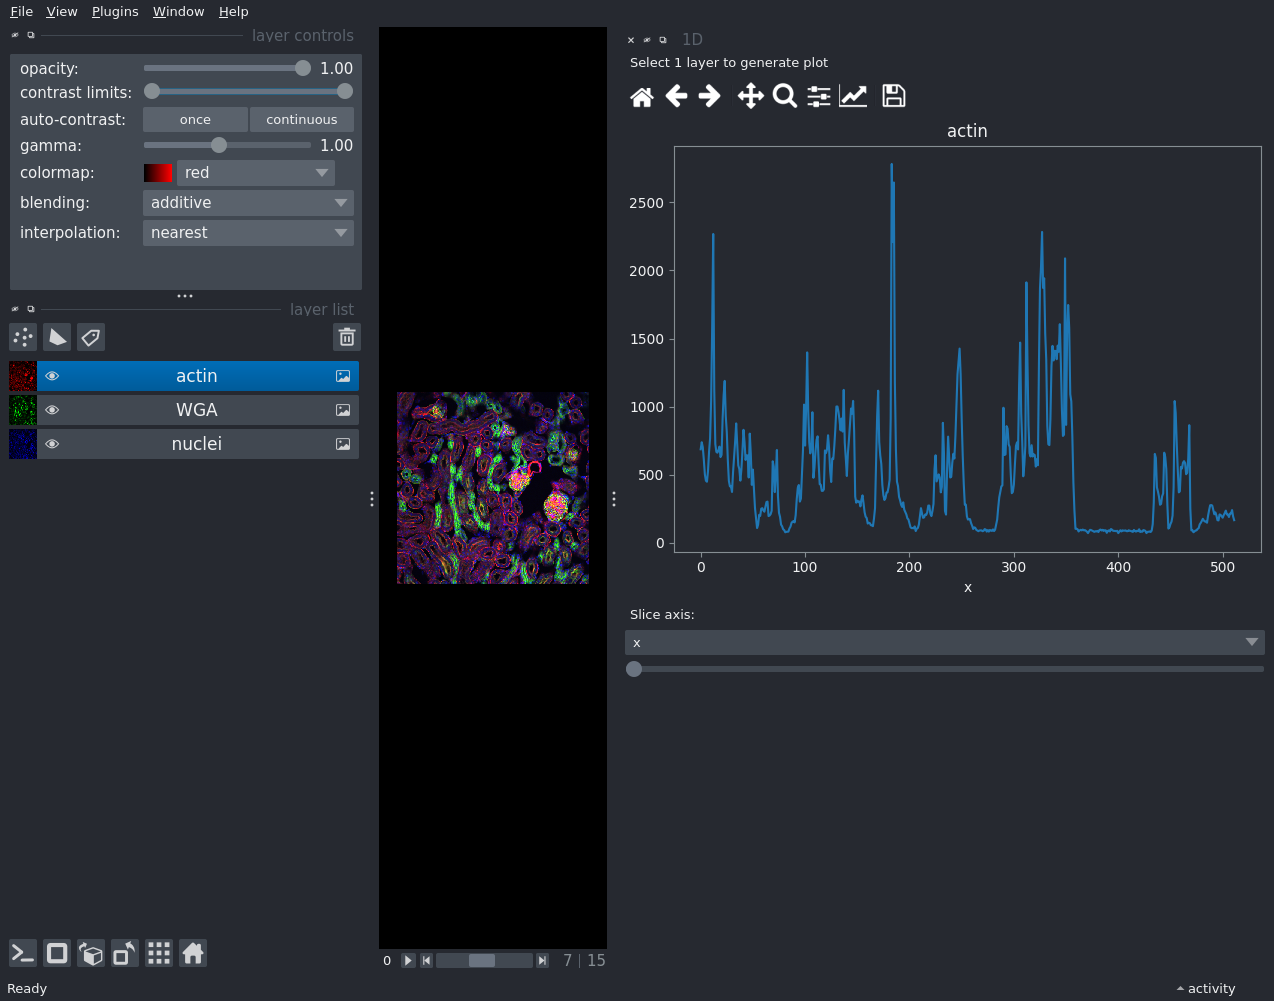
1D slices#

slice
import napari

viewer = napari.Viewer()
viewer.open_sample("napari", "kidney")

viewer.window.add_plugin_dock_widget(
    plugin_name="napari-matplotlib", widget_name="1D slice"
)

if __name__ == "__main__":
    napari.run()

Total running time of the script: (0 minutes 1.728 seconds)

Download Jupyter notebook: slice.ipynb

Download Python source code: slice.py

Gallery generated by Sphinx-Gallery

previous

Scatter plots

next

Histograms

Show Source

© Copyright 2022, David Stansby.

Created using Sphinx 7.3.7.

Built with the PyData Sphinx Theme 0.15.4.