Note
Go to the end to download the full example code.
Histograms#

import napari

viewer = napari.Viewer()
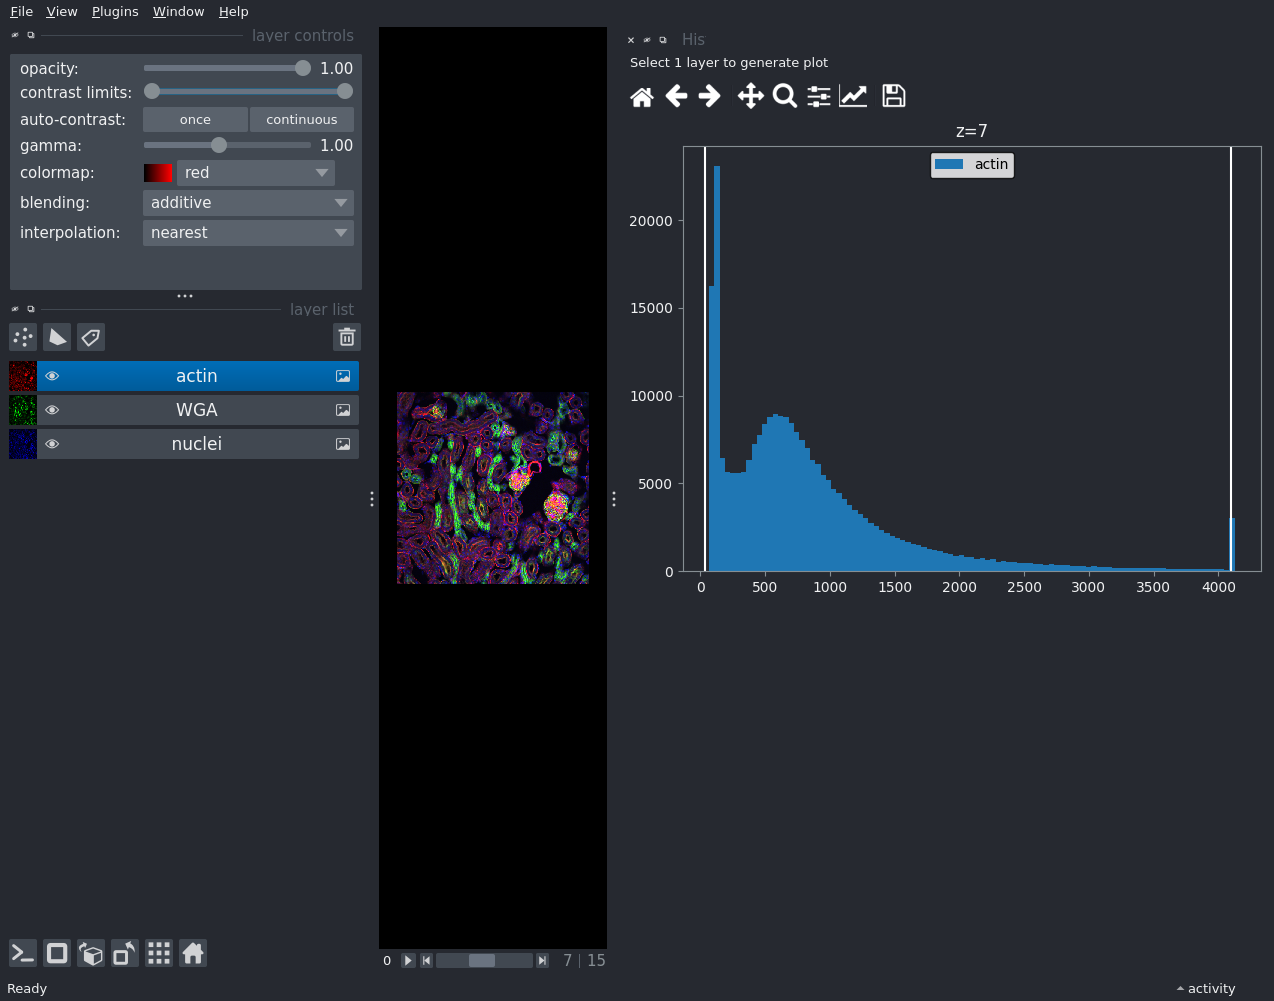
viewer.open_sample("napari", "kidney")

viewer.window.add_plugin_dock_widget(
    plugin_name="napari-matplotlib", widget_name="Histogram"
)

if __name__ == "__main__":
    napari.run()
Total running time of the script: (0 minutes 1.804 seconds)
