API reference#
This section documents the internal API of napari-matplotlib classes.
Most users shouldn’t need this, and will just directly interact with the
plots though the napari user interface.
napari_matplotlib Package#
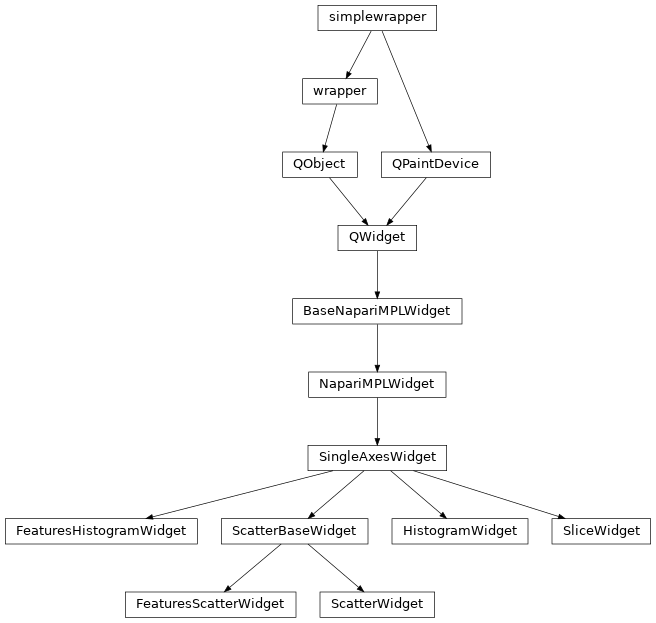
Classes#
|
Display a histogram of selected feature attached to selected layer. |
|
Widget to scatter data stored in two layer feature attributes. |
|
Display a histogram of the currently selected layer. |
|
Base class for widgets that scatter two datasets against each other. |
|
Scatter data in two similarly shaped layers. |
|
Plot a 1D slice along a given dimension. |
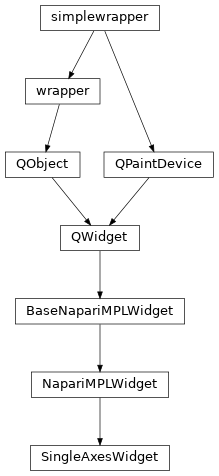
Class Inheritance Diagram#
napari_matplotlib.base Module#
Classes#
|
Widget containing Matplotlib canvas and toolbar themed to match napari. |
|
Widget containing a Matplotlib canvas and toolbar. |
|
In addition to |
Class Inheritance Diagram#